ORES and ORES Assets in a few figures

Operational data
| Operational data | Year 2024 |
|---|---|
| Length of the electricity network | 53,328 km |
| Length of the natural gas network | 10,213 km |
| Total number of points of supply of electricity (Active EANs) |
1,415,427 |
| Total number of points of supply of natural gas (Active EANs) |
536,440 |
| Total quantity of electricity distributed | 10,814,301 MWH |
| Total quantity of natural gas distributed | 12,593,995 MWH |
Investments
| Investments | 2024 |
|---|---|
| Net investments* | 349.2 Mio EUR |
| Gross investments | 434.2 Mio EUR |
*Net investments means the gross investments from which customer interventions have been removed from the investments.
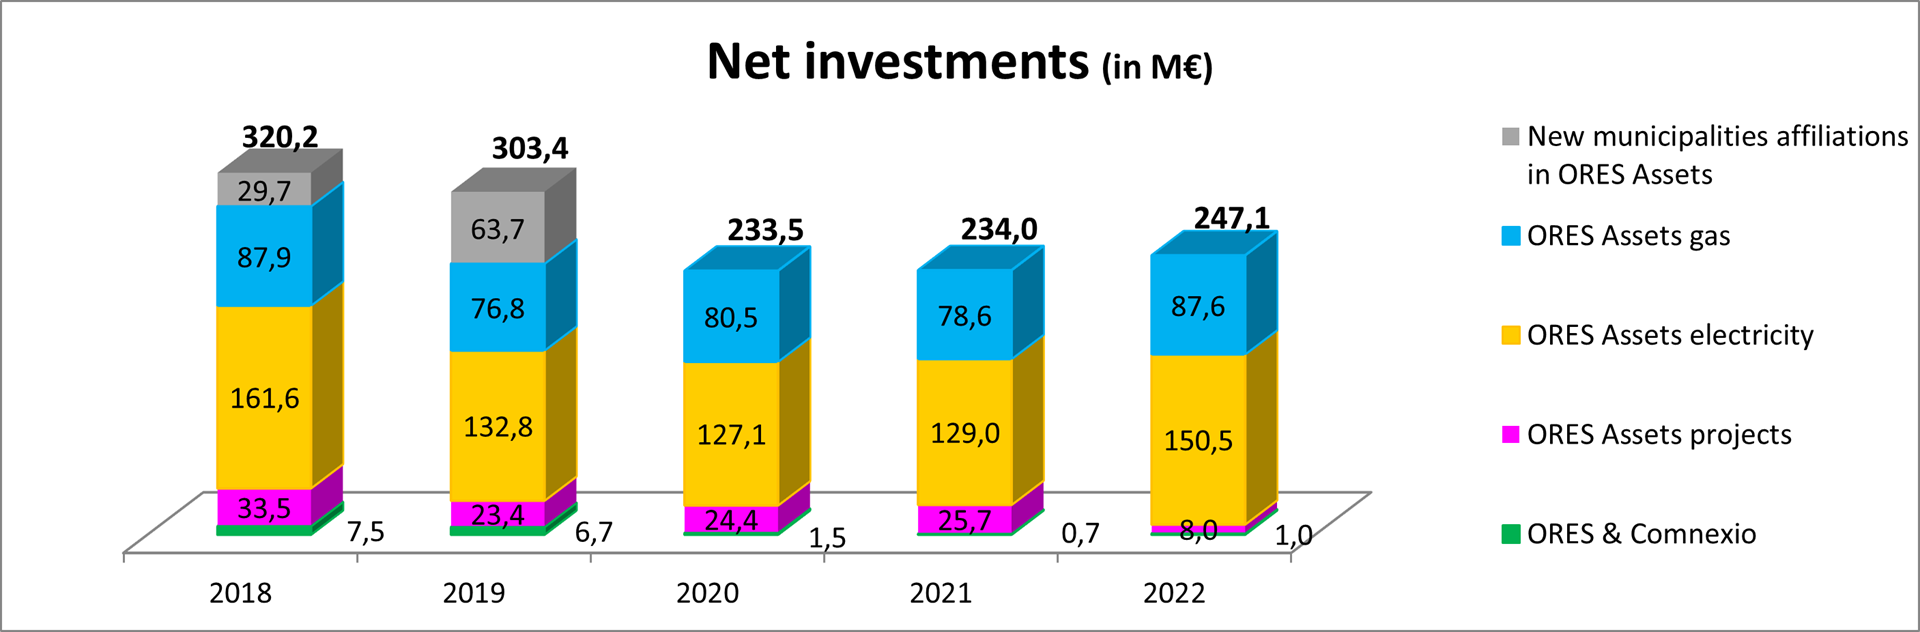
Total investments
Net investments in the electrical and gas networks (in millions of euros)
Gross investments in the electrical and gas networks (in millions of euros)

Investment allocation
Investment allocation in the electricity distribution network in 2024 by group of activities

In electricity :
LV = low voltage
MV = medium voltage
Investment allocation in the gas distribution network in 2024 by group of activities

Gas :
LP = low pressure
MP = medium pressure
Financial data by company (B GAAP)
| Financial data | 2024 | 2023 | 2022 | 2021 | 2020 |
|---|---|---|---|---|---|
| ORES’ turnover | 718 Mio EUR | 711 Mio EUR | 614 Mio EUR | 584 Mio EUR | 562 Mio EUR |
| ORES Assets’ turnover | 1,062 Mio EUR | 1,124 Mio EUR | 1,043 Mio EUR | 1,263 Mio EUR | 1,214 Mio EUR |
| ORES total balance sheet | 2,433 Mio EUR | 2,225 Mio EUR | 2,284 Mio EUR | 2,172 Mio EUR | 1,893 Mio EUR |
| ORES Assets total balance sheet | 4,874 Mio EUR | 4,637 Mio EUR | 4,554 Mio EUR | 4,560 Mio EUR | 4,316 Mio EUR |
Consolidated financial data
| Financial data | 2024 | 2023 | 2022 | 2021 | 2020 |
|---|---|---|---|---|---|
| Operating income (turnover and other operating income, including regulatory balances) | 1,106 Mio EUR | 1,204 Mio EUR | 1,117 Mio EUR | 1,302 Mio EUR | 1,249 Mio EUR |
| EBITDA | 350 Mio EUR | 355 Mio EUR | 330 Mio EUR | 476 Mio EUR | 471 Mio EUR |
| EBIT | 144 Mio EUR | 153 Mio EUR | 133 Mio EUR | 291 Mio EUR | 259 Mio EUR |
| Financial result | - 51 Mio EUR | -46 Mio EUR | -12 Mio EUR | -19 Mio EUR | -35 Mio EUR |
| Net profit for the period | 67 Mio EUR | 92 Mio EUR | 89 Mio EUR | 177 Mio EUR | 197 Mio EUR |
| Comprehensive income for the period | 67 Mio EUR | 111 Mio EUR | 94 Mio EUR | 194 Mio EUR | 170 Mio EUR |
| Current assets | 340 Mio EUR | 409 Mio EUR | 654 Mio EUR | 616 Mio EUR | 389 Mio EUR |
| Non-current assets | 4,534 Mio EUR | 4,459 Mio EUR | 4,386 Mio EUR | 4,318 Mio EUR | 4,264 Mio EUR |
| Financial debt | 2,473 Mio EUR | 2,271 Mio EUR | 2,279 Mio EUR | 2,293 Mio EUR | 2,555 Mio EUR |
| Total equity (including regulatory balances) | 2,016 Mio EUR | 2,028 Mio EUR | 1,990 Mio EUR | 1,967 Mio EUR | 1,860 Mio EUR |
| Total balance sheet (assets - without regulatory balances) | 4,874 Mio EUR | 5,031 Mio EUR | 5,020 Mio EUR | 5,017 Mio EUR | 4,737 Mio EUR |
| Total balance sheet (including regulatory balances) | 5,145 Mio EUR | 5,041 Mio EUR | 5,076 Mio EUR | 5,022 Mio EUR | 4,768 Mio EUR |
Financial ratios B GAAP
| Financial ratios B GAAP | 2024 | 2023 | 2022 | 2021 | 2020 |
|---|---|---|---|---|---|
| Equity ratio/total balance sheet for ORES Assets | 42.07% | 42.03% | 42.10% | 41.90% | 41.69% |
| Equity ratio/total consolidated balance sheet | 40.54% | 40.68% | 40.24% | 40.78% | 40.58% |
Operational data
| Operational data | Year 2024 |
|---|---|
| Length of the electricity network | 53,328 km |
| Length of the natural gas network | 10,213 km |
| Total number of points of supply of electricity (Active EANs) |
1,415,427 |
| Total number of points of supply of natural gas (Active EANs) |
536,440 |
| Total quantity of electricity distributed | 10,814,301 MWH |
| Total quantity of natural gas distributed | 12,593,995 MWH |